HEALTHCARE
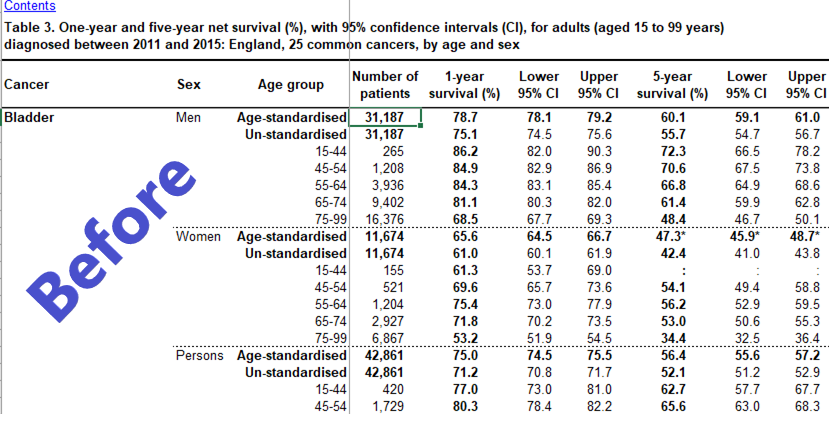
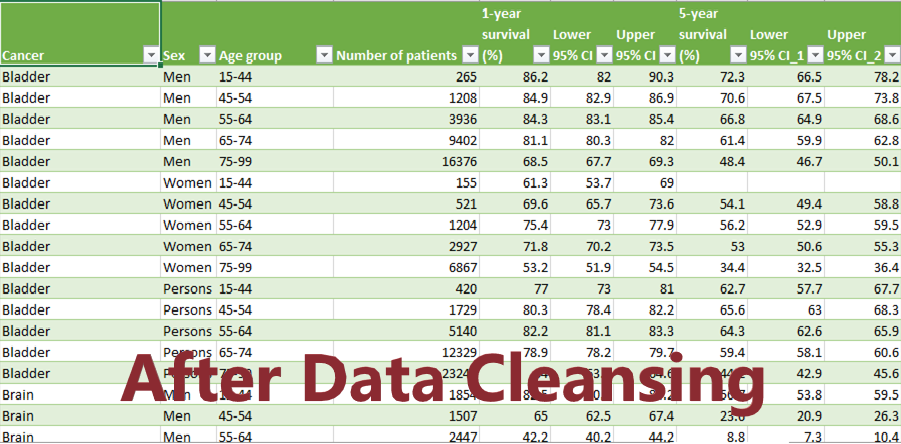
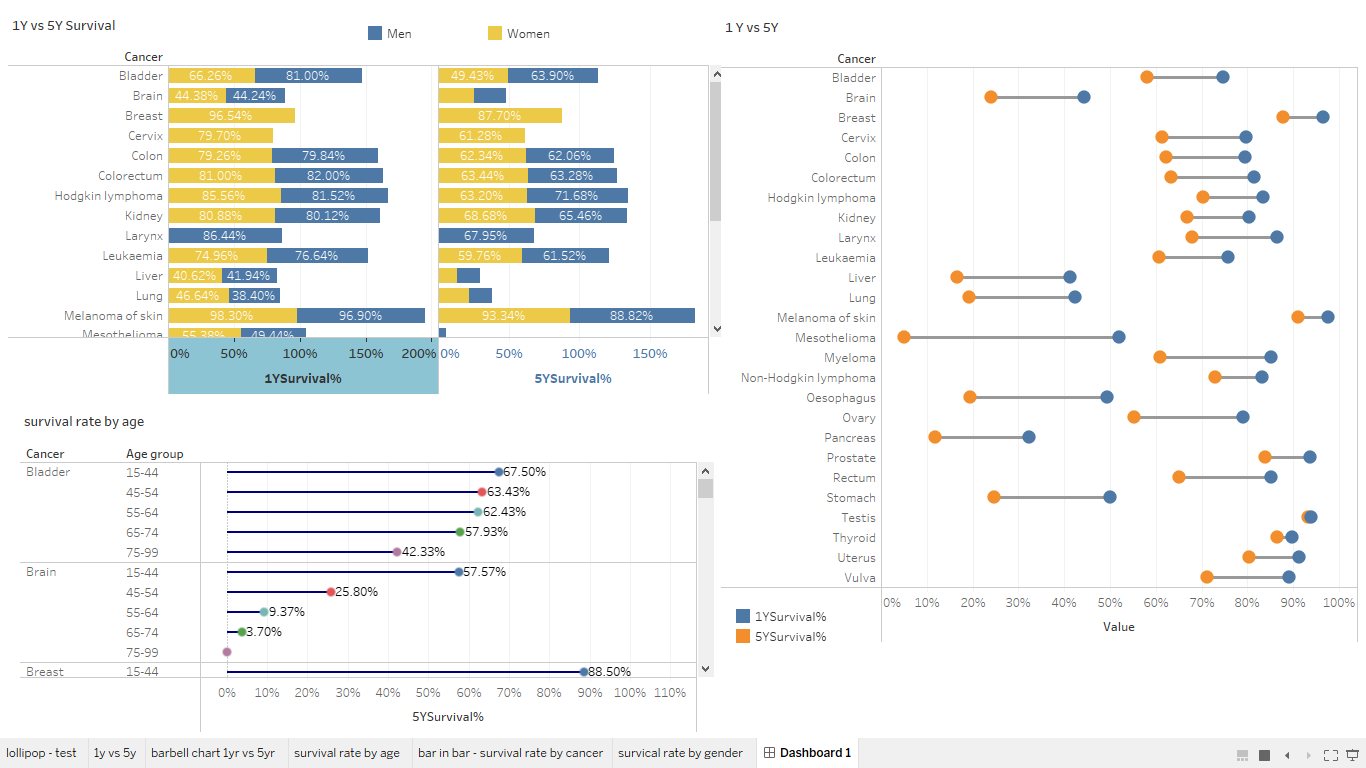
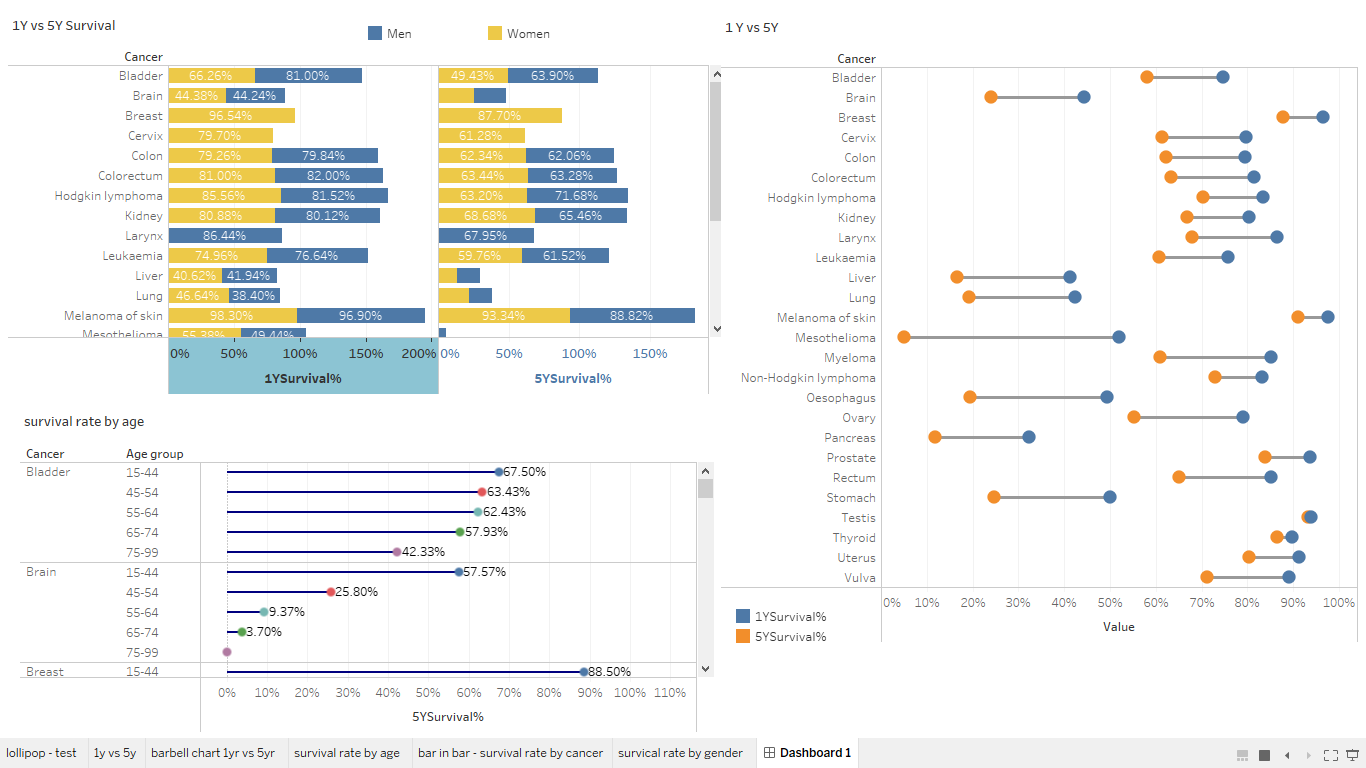
Cancer Survival - 1year vs. 5 year
- Manipulation of multiple data sets to combine into a single data set
- Format the data in order to be analysed
- Clean-up errors and data discrepancies
- Create a Tableau Dashboard
FORECAST
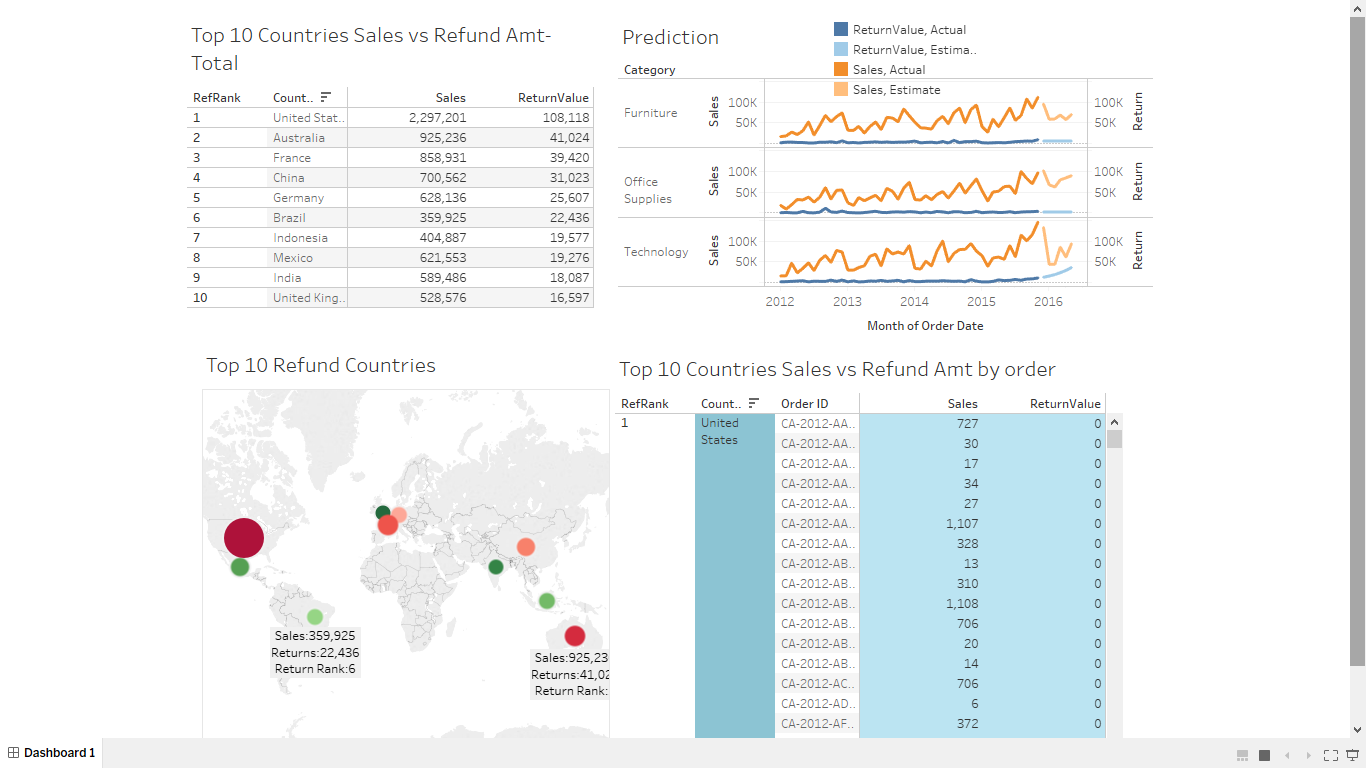
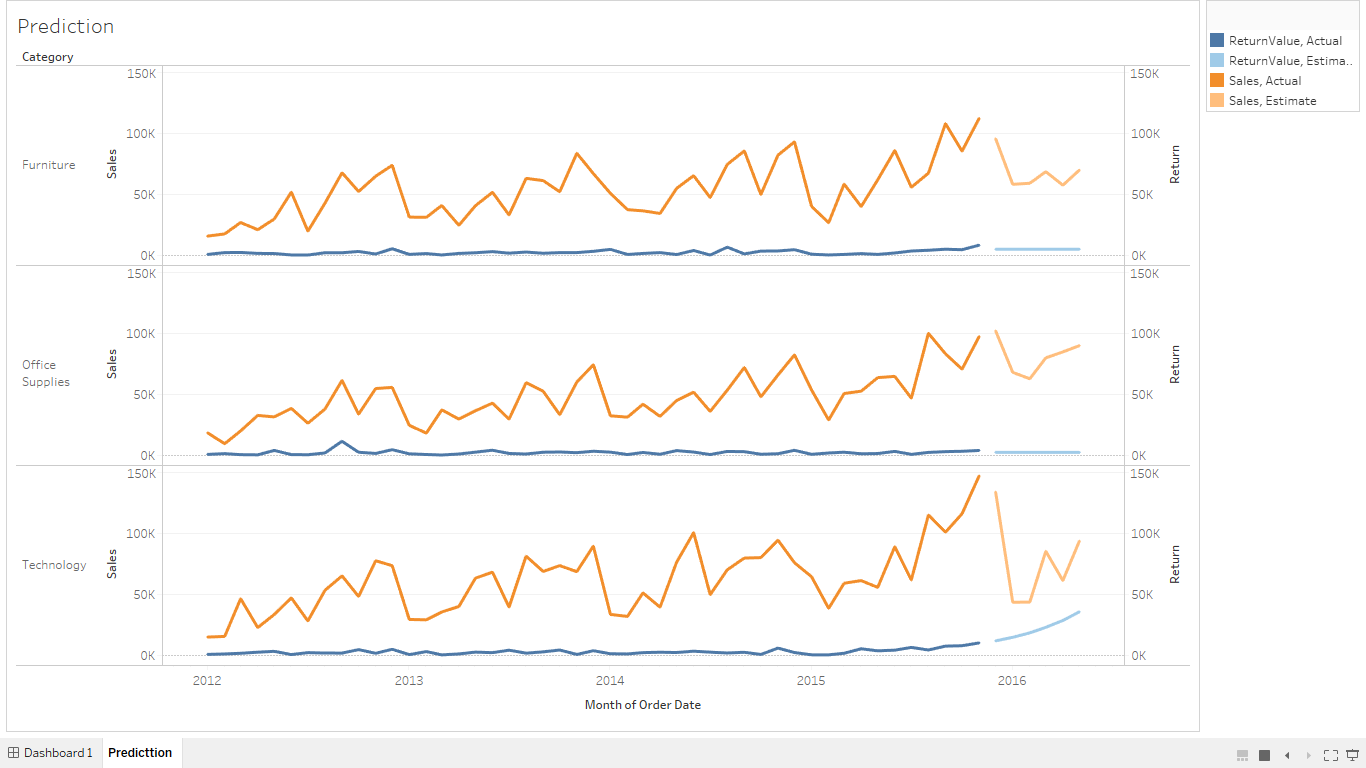
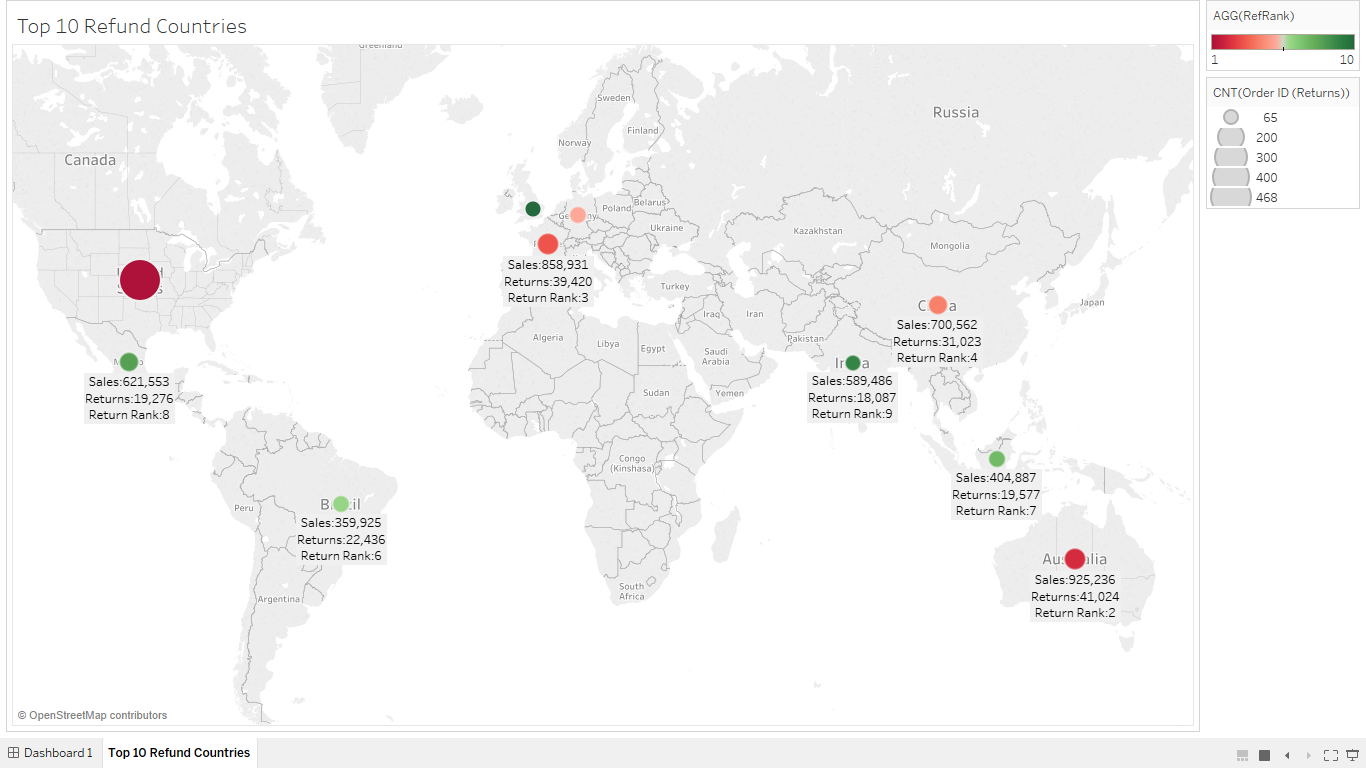
Sales and Refunds Forecast
- Analyse sales and refunds data over a period of time
- Generate forecast for coming years
- Create a Tableau Dashboard with Sales, Refunds and Forecast
BIG DATA ANALYSIS
Analyse large sets of Data
- Ability to analyse millions of rows and provide insights
- Generate Dashboards and Reports
- Ability to slice and dice the data for further details
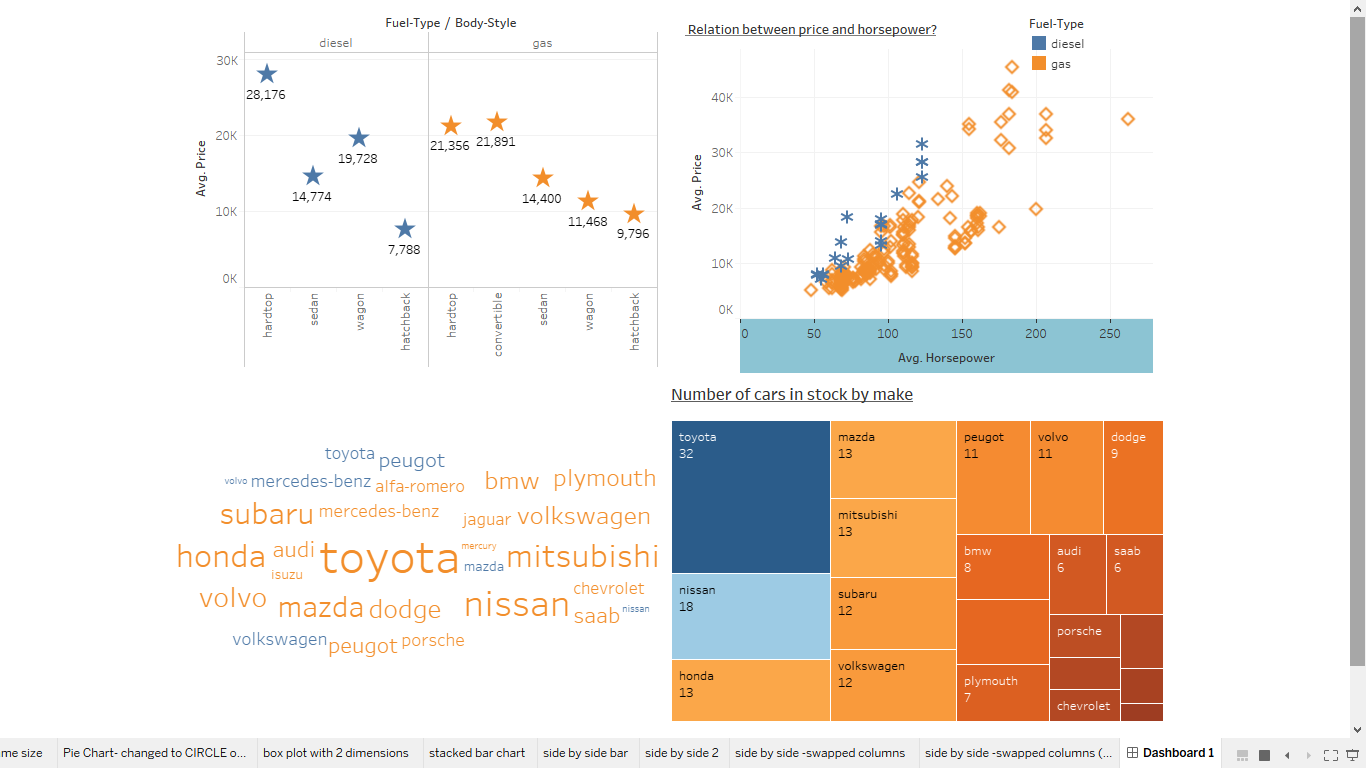
INTERACTIVE DASHBOARDS
- Allow users to interact with dashboards and obtain insights
- Insights can be available at all departmental levels
- Dashboards can be created for all types of business
- From the small business to the large corporation,
dashboards are useful for all.
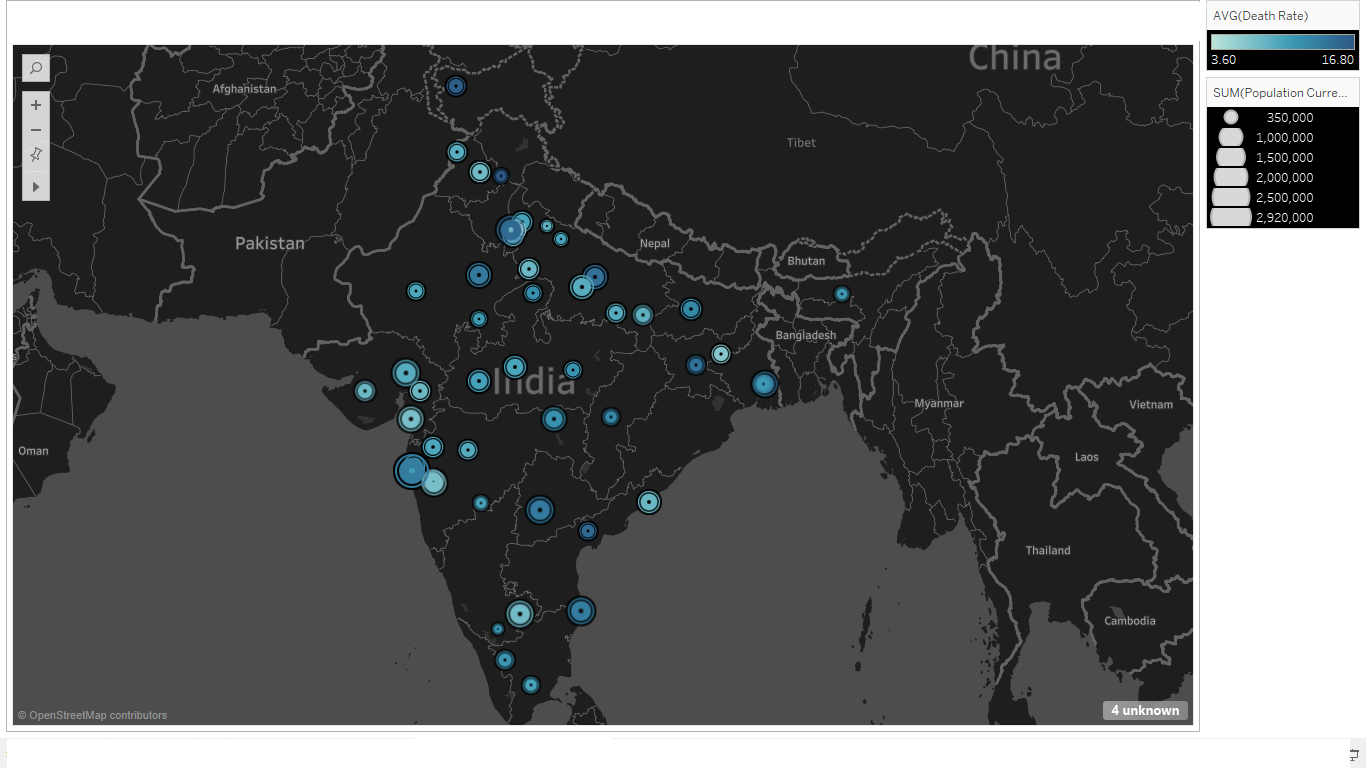
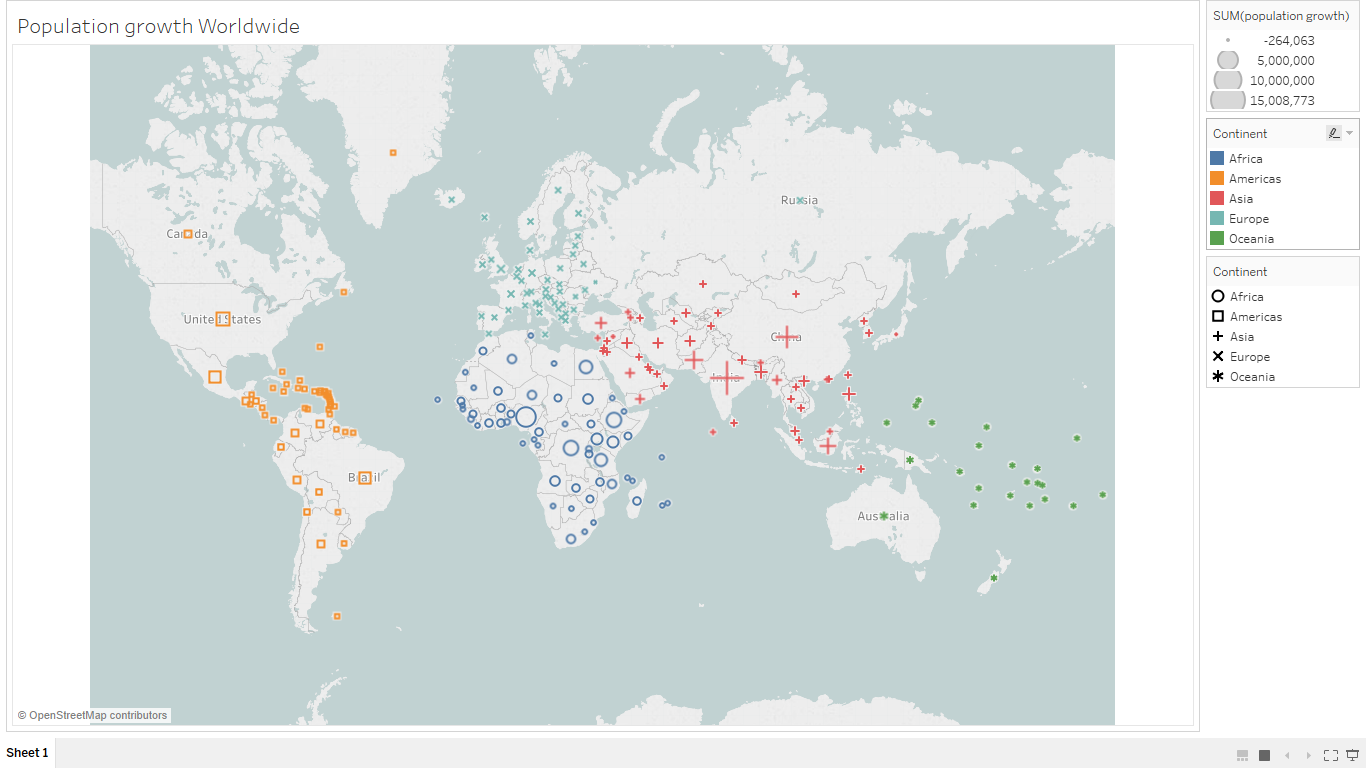
GEOSPATIAL MAPS
Display geographically based data in a map
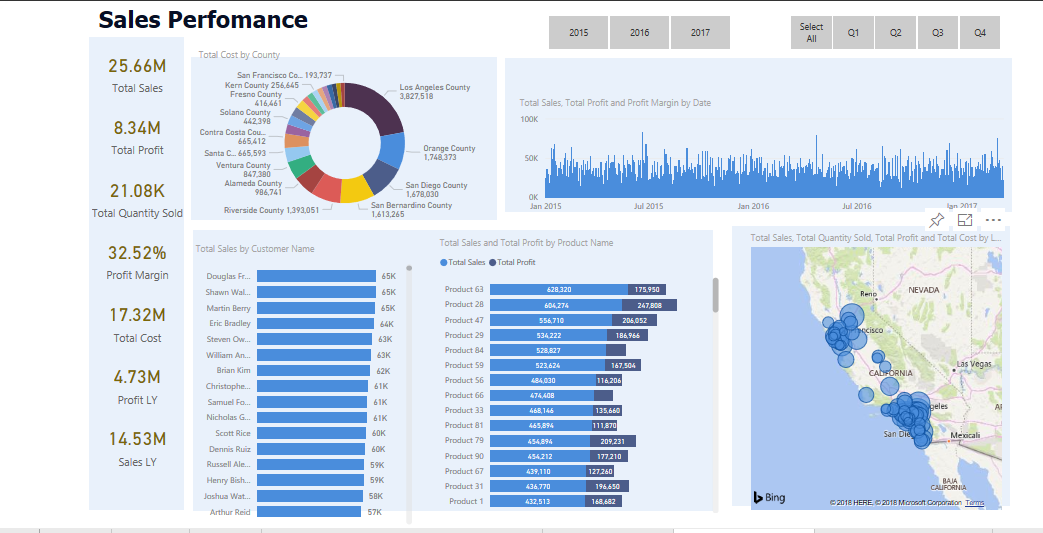
LIVE UPDATING DASHBOARDS IN POWER BI
Power BI Service gives us the ability to create real time dashboards.
- KPI analysis
- YTD vs Same time last year analysis
- Increase or decrease in sales/clients
- Profit and Loss
- Cost vs Sales

